Stocks Dashboard
Stock Dashboard Screen provides the snapshot of your Stock Portfolio's performance. It also contains various visual representations which help you to understand your Stock Portfolio's performance - Visually.
You can reach Stock Dashboard in any one of the following ways.
1. Clicking Shortcut available on the Desktop.
2. By Navigating via, Start -> My Stocks -> Dashboard
Top Menu Bar
Stock Dashboard contains the following Top Menu options,

● Portfolio - Click to open the Stock Portfolio Screen. Shows your current portfolio of Stocks.
● Holdings - Click to open the Stock Holdings Screen. Shows your current Stock Holdings.
● Gainers & Losers - Click to open Gainers & Losers Screen. Shows Gainers & Losers among your portfolio of your Stocks.
● Profit & Loss - Click to open Profit & Loss Screen. Shows Profit n Loss statement of your Stock Portfolio over a period of time (By default, shows for current Financial Year).\
● Manage Stocks - Click to Manage Stocks Screen. Helps you to manage your stocks to be used under Money Manager.
● Manage Cash - Click to Manage Cash Screen. Helps you to maintain the Cash Amount available in your stock trading account.
Markets Today
Shows the latest closing rates for the market along with your Stock Portfolio's worth today.

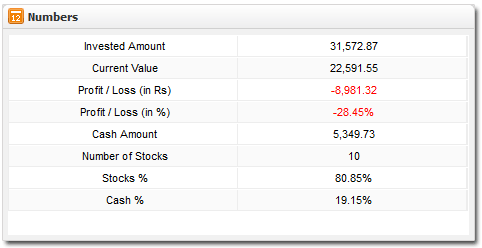
Numbers
Shows the important numbers that matter most in your Stock Portfolio.
Stock Allocations
Shows the weightage of your stocks in your Stock Portfolio.
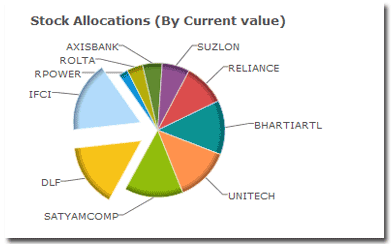
Helps you to under your stock weightage, so that you can decide on your future Buy / Sell based on the current weightage of your Stock Portfolio. To know more about your Stock allocations, head over to Holdings Screen.
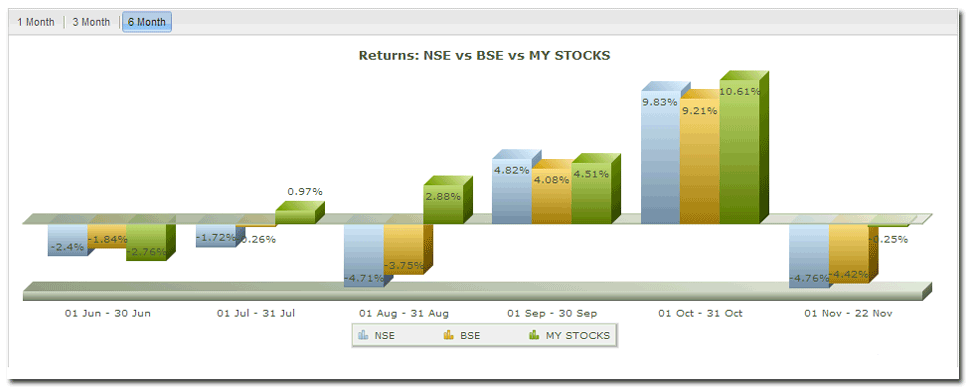
Returns Comparison
Shows the Returns Comparison of your Stock Portfolio along with Nifty and Sensex returns. You can compare how well your Stock Portfolio is performing against the major indexes for "Week-On-Week" basis for the one month period.

When you change the duration to "6 month" then you can compare your Stock Portfolio on "Month-On-Month" basis for the last 6 months.
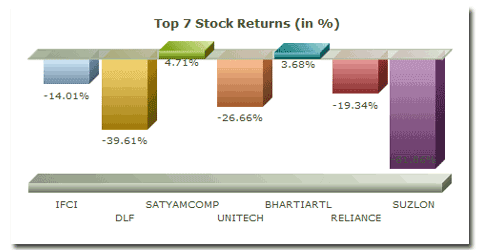
Stock Returns
Shows the columnar representation for your top weighted stocks (Max 7 Stocks) returns.
Last One Month Returns
Shows the returns for the last month of your Stock Portfolio.
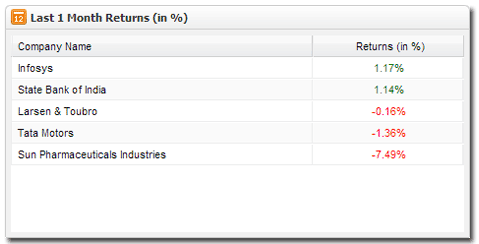
Tip: Double click on any of the row to open the Company Quote for the selected company.
Will help you understand how the returns of your Stock Portfolio stocks were performing in the last one month which in turn helps you re align your Stock Portfolio as per your needs.
Note: Some of the visual representations will not be available if your portfolio is empty. So add your stocks transactions into Money Manager to enjoy the fullest benefit. Click here to know about adding Stock Transactions to your portfolio.
Tip: Hover the Mouse over any of the visual representation to know more about the item.
Created with the Personal Edition of HelpNDoc: Easily create PDF Help documents